Tide Basics
How to Read a Tide Chart
Understand high and low tides, rising and falling water, and how tide predictions, residuals and forecasts fit into a fishing plan on Outgoing Tide.
Every angler has asked some version of the same question: what's the tide doing today, and what does that actually mean for my trip? A tide chart is a good start — but it's only a start. Here's how to read one properly, and how to use everything else on this site to close the gap between what's predicted and what's really happening on the water.
What a Tide Chart Actually Tells You
Every tide chart, no matter where you find it, is answering one basic question: when is the water going to be high, and when is it going to be low? That's it. Underneath the numbers, a tide chart is a prediction — built from the gravitational pull of the moon and sun on the earth's oceans, calculated years in advance based on the geometry of the coastline at a specific location.
A few terms worth knowing cold, since we'll build on them:
- High tide / low tide — the peak and the trough of the water level at a given point in its cycle
- Flood tide (incoming) — water is rising, moving from low toward high
- Ebb tide (outgoing) — water is falling, moving from high toward low
- Slack tide — the short window at the top or bottom of the cycle when the water isn't really moving in either direction yet
Most coastal areas, including ours here in Northeast Florida, run on what's called a semidiurnal tide — two highs and two lows every day, roughly 12 hours and 25 minutes apart. That extra 25 minutes is why the tide creeps later each day rather than repeating at the same clock time — it's tied to the moon's orbit, not the 24-hour clock we live by.
The height difference between a given high and low — called the tidal range — isn't fixed either. It swells during the new and full moon (called a spring tide, nothing to do with the season) when the sun and moon align and pull together, and shrinks during the first and last quarter moon (a neap tide) when their pull partially cancels out.
That's the chart. It's a solid, reliable baseline — and for a lot of fishing days, it's most of what you need to know before you head out.
But it's also where most tide charts stop, and where the real decision-making actually begins.
Why We Built the Site in This Order — and What the Chart Doesn't Tell You
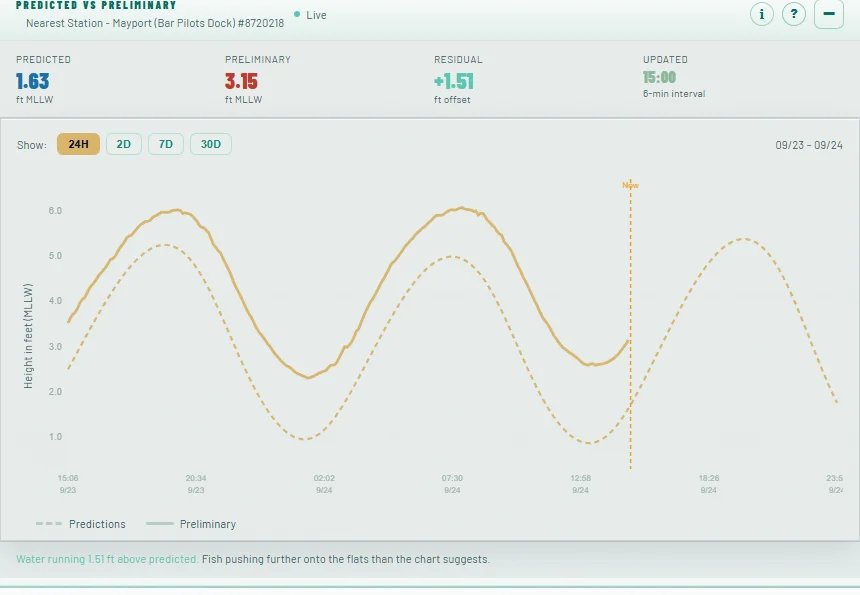
Here's something worth understanding before you ever look at a single number: a tide chart is a prediction, not a report. It's calculated years in advance from the moon and sun's pull on the water — it has no idea what the wind did yesterday, whether a front is stalled offshore, or how much rain just came down the river. That gap between what the chart predicted and what the water is actually doing is the single biggest thing separating a good day on the water from a frustrating one.
That gap is exactly why we built Outgoing Tide's homepage in the order we did — and it's worth knowing why, because the order isn't just design, it's how we think you should actually use the information.
Current conditions come first because when you're standing on a boat ramp or checking your phone before you leave the dock, you don't have time to scroll. You need to know what's happening right now, immediately, without digging for it.
The local tide chart comes next — the fundamentals we just walked through. High, low, flood, ebb, the natural rhythm of the day. This is your baseline.
Then comes the piece most tide sites don't have at all: the residual graph — the over/under reading showing how the tide at your station is actually running compared to what was predicted.
This is the number that matters most, and here's why. Wind doesn't just affect waves — it physically pushes water around, piling it up against the coast or pulling it away, independent of what the moon says should be happening. A sustained wind out of the west or west-northwest, for example, drains a channel like the Matanzas noticeably faster than standard fetch formulas would predict — something we've confirmed through real, on-the-water calibration, not just theory. A Bermuda High locked in a few hundred miles offshore produces a reliably higher baseline tide than the prediction alone would suggest. Even a distant low-pressure system, one that never comes anywhere near us, can pile water against the coast if the geometry is right.
None of that shows up on a standard tide chart. It shows up as residual — the gap between predicted and actual — and that gap is often the difference between a flat that's actually fishable and one that's still six inches too skinny to run, or a point that's holding bait an hour later than the chart says it should.
Fishermen and boaters who only check the predicted chart are, in a real sense, planning around a number that's already slightly wrong before the day even starts. Checking the residual is checking reality.
Hourly Forecast: Knowing What's Coming Before You're Caught in It
A 7-day forecast tells you what kind of day to expect. It doesn't tell you what's going to happen at 2 PM specifically — and on the water, that specificity is what actually matters.
The single most important reason we built out an hour-by-hour breakdown is safety. A forecast that says "chance of storms" for the day doesn't tell you whether that's a 9 AM system that clears by noon or a line building through the afternoon right as you're running back from the furthest point of your trip. The hourly view lets you see when serious weather is expected to move through — not just that it's coming — so you can plan your day around it instead of getting caught by it. If there's a real weather threat on the board, that's the first thing worth checking before you ever think about tide or bite windows.
Past that, the hourly forecast is where the tactical value lives. Wind doesn't hold steady all day, and the moments it shifts — in direction or in speed — are often exactly when the fishing changes too:
- A wind shift can turn a spot on or off. A point that's protected and calm at 7 AM with a light southeast wind can turn into an unfishable washing machine by 11 AM if that wind clocks around and builds. Knowing that shift is coming means you can fish that spot early and be somewhere else by the time it turns.
- Increasing wind speed changes water clarity and bait position, sometimes for the better, often for the worse. A building wind can muddy a flat you were counting on, or push bait — and the fish following it — right into a spot that was dead calm an hour before.
- Decreasing wind can open up water that was unfishable. Some of the best windows of a day happen in the lull right after a front passes, when the wind lays down before building back in from a new direction. Without an hourly view, that window is easy to miss entirely.
The chart and the residual reading tell you what the water is likely doing. The hourly forecast tells you what's about to change that — and on the water, being early to a shift, instead of caught by one, is often the whole difference in a day.
7-Day Forecast: Planning the Trip Before You're On the Water
Everything we've covered so far — current conditions, the tide chart, the residual, the hourly breakdown — is built for someone who's already on the water or about to be. The 7-day forecast serves a different moment entirely: the planning that happens days in advance, when you're deciding whether this weekend is worth clearing the calendar for, or whether you should push a trip back a few days.
That's exactly why it sits further down the page. It's not the thing you're urgently checking with your hand on the boat's throttle — it's the thing you check from the couch on a Tuesday, figuring out if Saturday's worth it.
Used well, the 7-day view isn't just "what's the weather going to be" — it's your first chance to spot the kind of setups that move everything else we've talked about. A front approaching midweek, a wind direction that's about to swing around, a stretch of building high pressure — these are the exact conditions that later show up as changes in your residual reading and your hourly forecast. Seeing them coming a few days out means you're not reacting to a bad tide day, you're avoiding one, or better, timing your trip to land right as conditions turn in your favor.
A few ways we'd suggest actually using it:
- Scan for the pattern, not just the number. A single day's forecast can look fine in isolation, but if it's sandwiched between a passing front and a wind shift, that day might be more volatile than the forecast alone suggests. Looking at the full week gives you the context a single day can't.
- Watch for wind direction trends, not just wind speed. A forecast showing several days of sustained wind from one direction is often a stronger signal for how a spot will be fishing than any single day's number.
- Use it to pick your day, not just your trip. If you've got flexibility across a weekend, the 7-day view is how you decide Saturday over Sunday, not just whether to go at all.
By the time your trip day actually arrives, the 7-day forecast has done its job — and that's when the current conditions, the chart, the residual, and the hourly forecast take over.
Water Temperature: Planning Your Target Species Before You Ever Launch
Every boat with a good electronics package can tell you the water temperature — the moment you're on the water. That's the catch. By the time your sonar is reading the temperature, you've already launched, already committed to a direction, and already burned the time it would've taken to plan around it instead of reacting to it.
We put water temperature on the site so that advantage starts before you leave the dock, not after.
Water temperature is one of the strongest drivers of where fish are, and how willing they are to eat, on any given day. A few degrees of change can push a species onto a flat or off it entirely, turn a normally aggressive feeder sluggish, or trigger a bite that wasn't happening the day before. Knowing that number before you launch means you're choosing where to run based on real information, not a guess you'll only get to correct once you're already out there.
That's also exactly why the species guide sits alongside the water temperature on the site, rather than as a separate, disconnected feature. Water temperature on its own is just a number — the species guide is what turns that number into a decision. It tells you which species are sitting in their prime temperature range right now, ready to eat, and which ones are outside of it and likely to be tougher to target or better left alone for the day.
Put together, this means you can look at one screen before you ever back the trailer down the ramp and know: here's the water temperature today, and here's which species that puts in play. That's a decision most anglers are used to making with their gut, or not making at all until they're already committed. Here, it's made with real data, from the driveway.
Putting It All Together
None of these six pieces are meant to be checked in isolation. Read together, in order, they're really answering one question at each stage of your trip: what's happening right now, what's the baseline, how far off is reality from that baseline, what's about to change, is this even the right day, and what should I be targeting when I get there.
That's the whole idea behind Outgoing Tide — not just another tide chart, but the actual judgment that goes into a good day on the water, laid out in the order you'd need it. The chart tells you what the moon says should happen. Everything else tells you what's actually happening, and what to do about it.
Check it before you leave the dock. Check it again once you're out there. That's the difference between fishing the prediction and fishing the water.
Field Notes combine marine-weather data, published scientific information and practical observations from anglers and guides. Conditions vary by location and can change rapidly.