
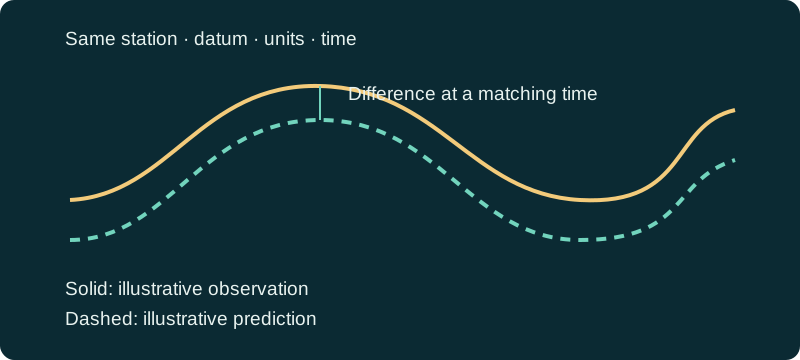
What question does each product answer?
A prediction asks what the recurring tide would be expected to do at a particular station. It is useful for comparing the sequence of highs and lows and placing a trip within that cycle. An observation asks what the water level was at a sensor at a recorded time. It is useful for checking whether the actual water is tracking the expected pattern. Neither product alone describes the whole route you intend to travel.
Outgoing Tide keeps these roles separate. The tide calendar supplies a planning reference, while available preliminary water-level information provides another piece of context. A prediction can exist at a location that has no operating water-level sensor. An empty observation panel therefore does not invalidate a tide table, and it certainly does not mean that the observed level equals the prediction.
Make a fair comparison before reading a residual
Start with station identity. Two numbers from different waterways are not a matched pair, even when the station names sound similar. Next check the timestamp, local time convention, height units, and vertical datum. The datum is the reference plane used for the height, not the bottom beneath a boat. Subtracting measurements that use different reference planes can produce an apparently large difference that says nothing useful about the weather.
A residual is the observation minus the prediction for a corresponding time and reference. A positive residual means that observation is above the prediction; a negative residual means it is below. Read it as a difference at that source location. Do not turn it into an automatic adjustment for every creek, launch, or sandbar in northeast Florida.
Illustrative calculation, not live data: if the prediction is 1.5 feet MLLW and the preliminary observation is 2.3 feet MLLW at the same station and time, the residual is 2.3 minus 1.5, or +0.8 feet. That says the sensor measured water above the predicted level at that reference point. It does not say there is 0.8 feet of additional clearance along a route. If the observation is from another station, uses another datum, or is older than the prediction, resolve that mismatch before interpreting a difference.
Why the curves can separate
Weather and water movement can produce departures from the expected astronomical pattern. Wind can redistribute water, pressure can contribute to level changes, and runoff can affect an estuary. Several influences may act together. The sign of a residual does not establish which cause dominated, and one reading is not a diagnosis of a regional event.
For planning around the Matanzas River, the useful response is to investigate a sustained discrepancy. Check official coastal forecasts and the surrounding observations if available. Ask whether the return route depends on a shallow crossing or exposed landing. A curve that looks normal at City Dock cannot certify a different waterway, while an unusual curve should prompt more checking rather than a confident estimate of extra clearance.
Preliminary does not mean final
Recent readings can be delayed, interrupted, flagged, or revised as quality control progresses. Read the source time before calling a number current. A graph may continue to show an older successful reading during a communications problem. A smooth display does not prove every point is a fresh measurement.
If a single value suddenly jumps and immediately returns, verify it against the provider before building a trip decision around it. If observations stop, use the official source to check availability and treat the missing interval as unknown. Do not mentally fill the gap with the predicted curve; that would erase the distinction the comparison is intended to show.
Hypothetical planning example: a shallow return
Suppose a shoreline angler plans to walk an access route that becomes covered as water rises. The tide table suggests a falling stage during the outward trip, but an available observation is above the corresponding prediction. The angler first checks that the time and station match, then checks official coastal conditions and the access route itself. The sensible result may be a different access point or an earlier departure, not a calculation that claims an exact safe walking window.
For a boater, the same discrepancy raises a different set of questions: whether the launch, bridge clearance, or return passage depends on water level. Extra water in one place does not eliminate waves, current, obstructions, or overhead-clearance concerns. This example supplies a method for asking questions, not a clearance rule.
Use the dashboard without overreading it
Open the tide calendar, confirm the selected station, and note the predicted highs and lows that bracket both departure and return. Where preliminary observations are available, examine their source identity and time. Then read wind, precipitation, and the official marine forecast. Keep a written note of any missing information so an attractive forecast icon does not make you forget an unresolved water-level question.
If the dashboard reports an error, the article and source links remain usable, but the error is not a substitute observation. Recheck the provider or change the plan when the missing information matters. The website does not measure depth along your route and should not be used as a standalone navigation or flood-warning product.
References and data sources
Sources support the physical concepts and data definitions. Planning examples are hypothetical, not field reports or forecasts for a particular day.